Copernicus: Warmest March In Europe & Lowest Arctic Winter Sea Ice

The Copernicus Climate Change Service (C3S), implemented by the European Centre for Medium-Range Weather Forecasts on behalf of the European Commission with funding from the EU, routinely publishes monthly climate bulletins reporting on the changes observed in global surface air and sea temperatures, sea ice cover, and hydrological variables. Most of the reported findings are based on the ERA5 reanalysis dataset, using billions of measurements from satellites, ships, aircraft, and weather stations around the world.
March 2025—Surface air temperature and sea surface temperature highlights:
Global Temperatures
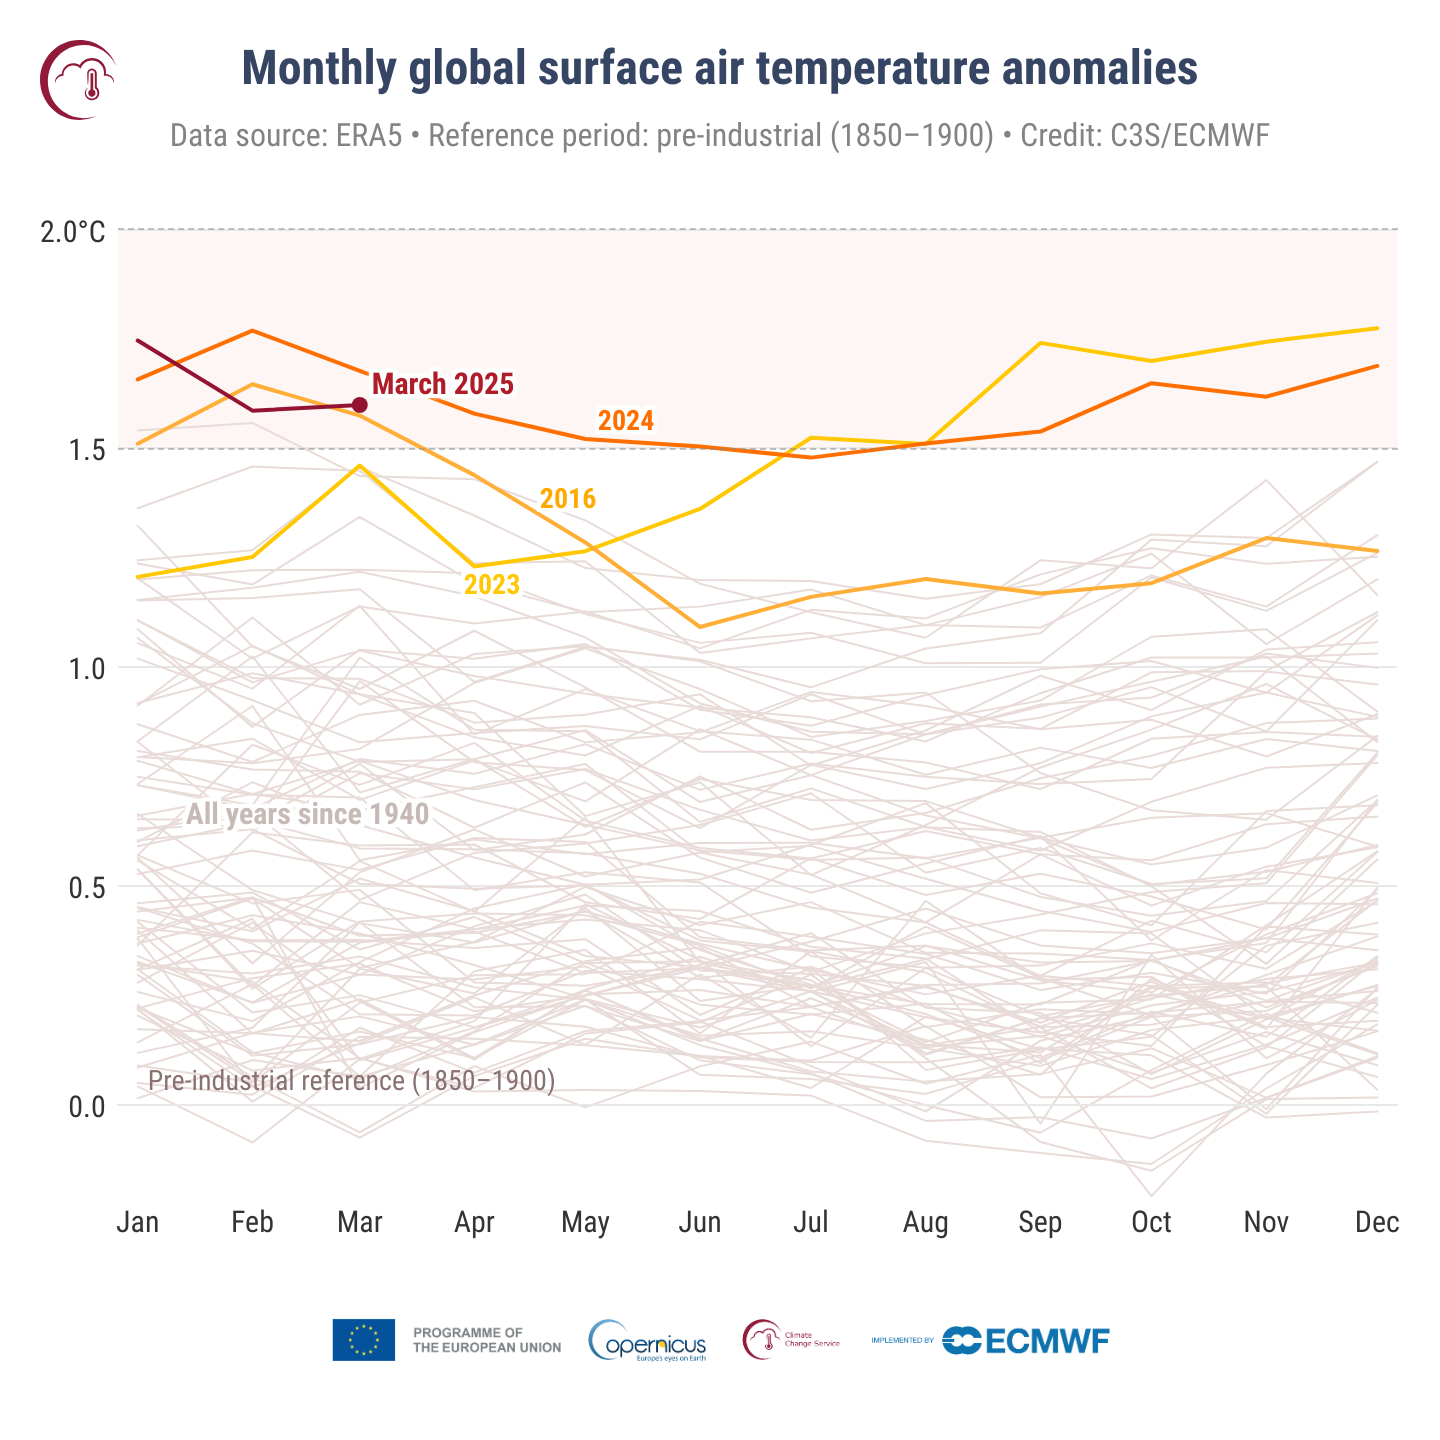
- March 2025 was the second-warmest March globally, with an average ERA5 surface air temperature of 14.06°C, 0.65°C above the 1991-2020 average and 1.60°C above the pre-industrial level for March.
- March 2025 was 0.08°C cooler than the record March of 2024 and only marginally warmer — by 0.02°C — than the third warmest March, in 2016.
- March 2025 was the 20th month in the last 21 months for which the global-average surface air temperature was more than 1.5°C above the pre-industrial level.*
The 12-month period of April 2024 – March 2025 was 0.71°C above the 1991–2020 average and 1.59°C above the pre-industrial level.
*Datasets other than ERA5 may not confirm the 20 months above 1.5°C highlighted here, due to the relatively small margins above 1.5°C of ERA5 global temperatures observed for several months and differences among the various datasets.
According to Samantha Burgess, strategic lead for climate at ECMWF, “March 2025 was the warmest March for Europe, highlighting once again how temperatures are continuing to break records. It was also a month with contrasting rainfall extremes across Europe, with many areas experiencing their driest March on record and others their wettest March on record for at least the past 47 years.”
Europe and other regions
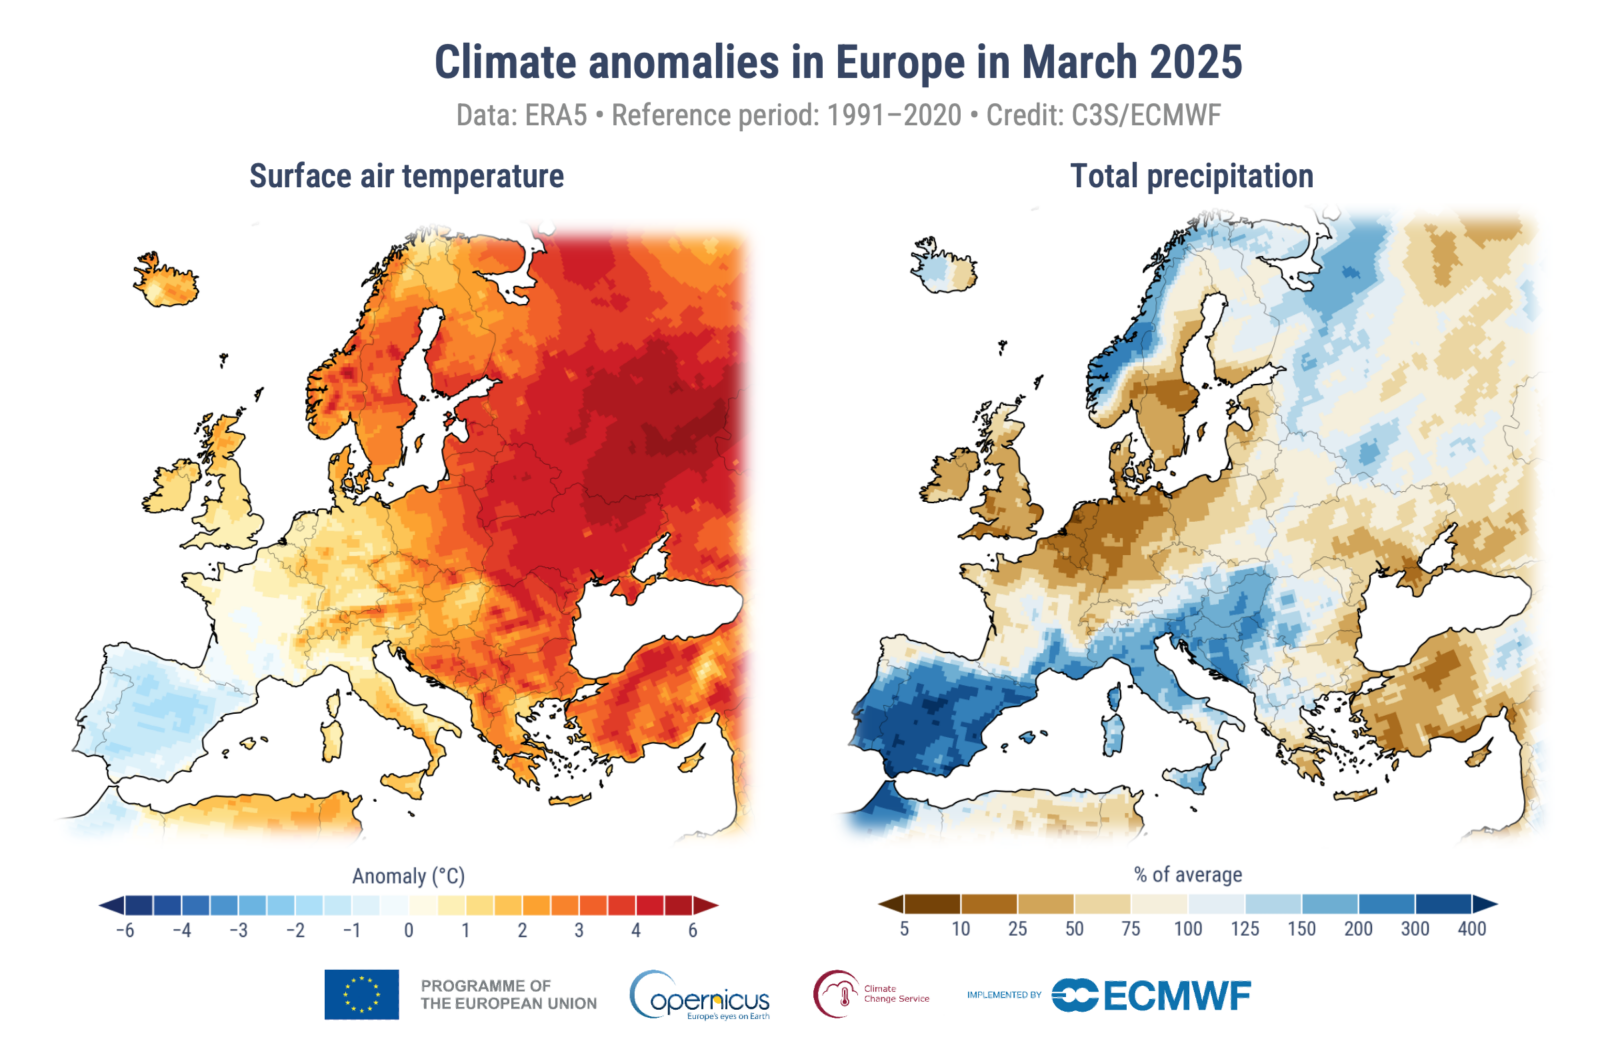
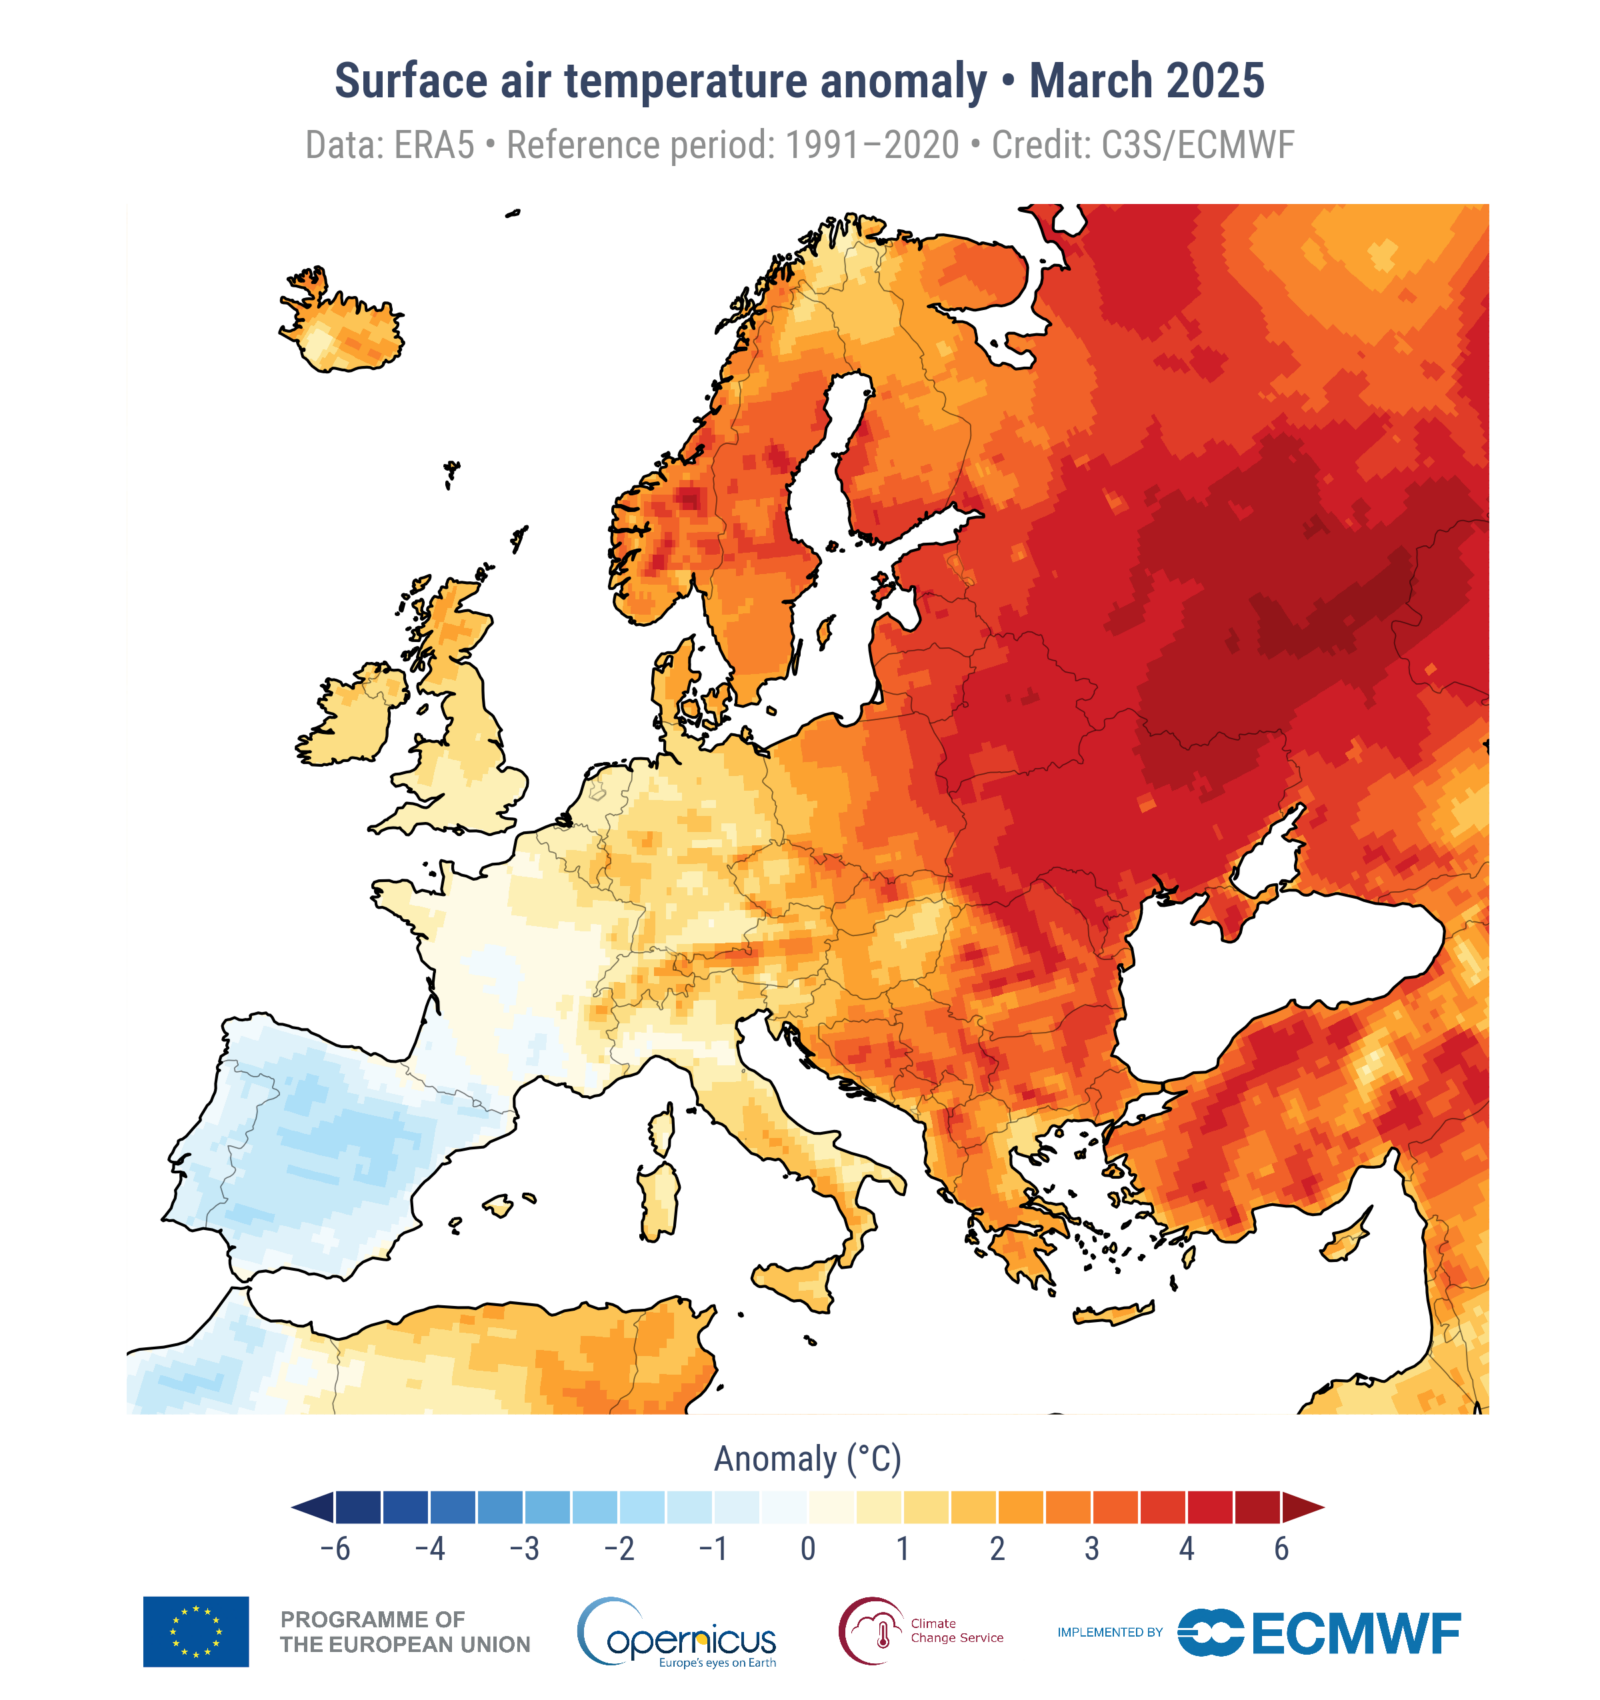
- The average temperature over European land for March 2025 was 6.03°C, 2.41°C above the 1991-2020 average for March, making it the warmest March for Europe
- Temperatures were predominantly above average across Europe, with the largest warm anomalies recorded over eastern Europe and southwest Russia, although across the Iberian Peninsula, colder-than-average temperatures occurred
- Outside Europe, temperatures were most above average over large parts of the Arctic, in particular over the Canadian Archipelago and Baffin Bay. They were also above average over the United States, Mexico, parts of Asia, and Australia.
- Temperatures were most below average over northern Canada, Hudson Bay, and eastern Russia, including the Kamchatka Peninsula
Sea surface temperature
- The average sea surface temperature (SST) for March 2025 over 60°S–60°N was 20.96°C, the second-highest value on record for the month, 0.12°C below the March 2024 record.
- SSTs remained unusually high in many ocean basins and seas. Some seas, such as the Mediterranean Sea and the northeast North Atlantic, saw larger record-breaking areas than last month.
March 2025—Sea ice highlights:
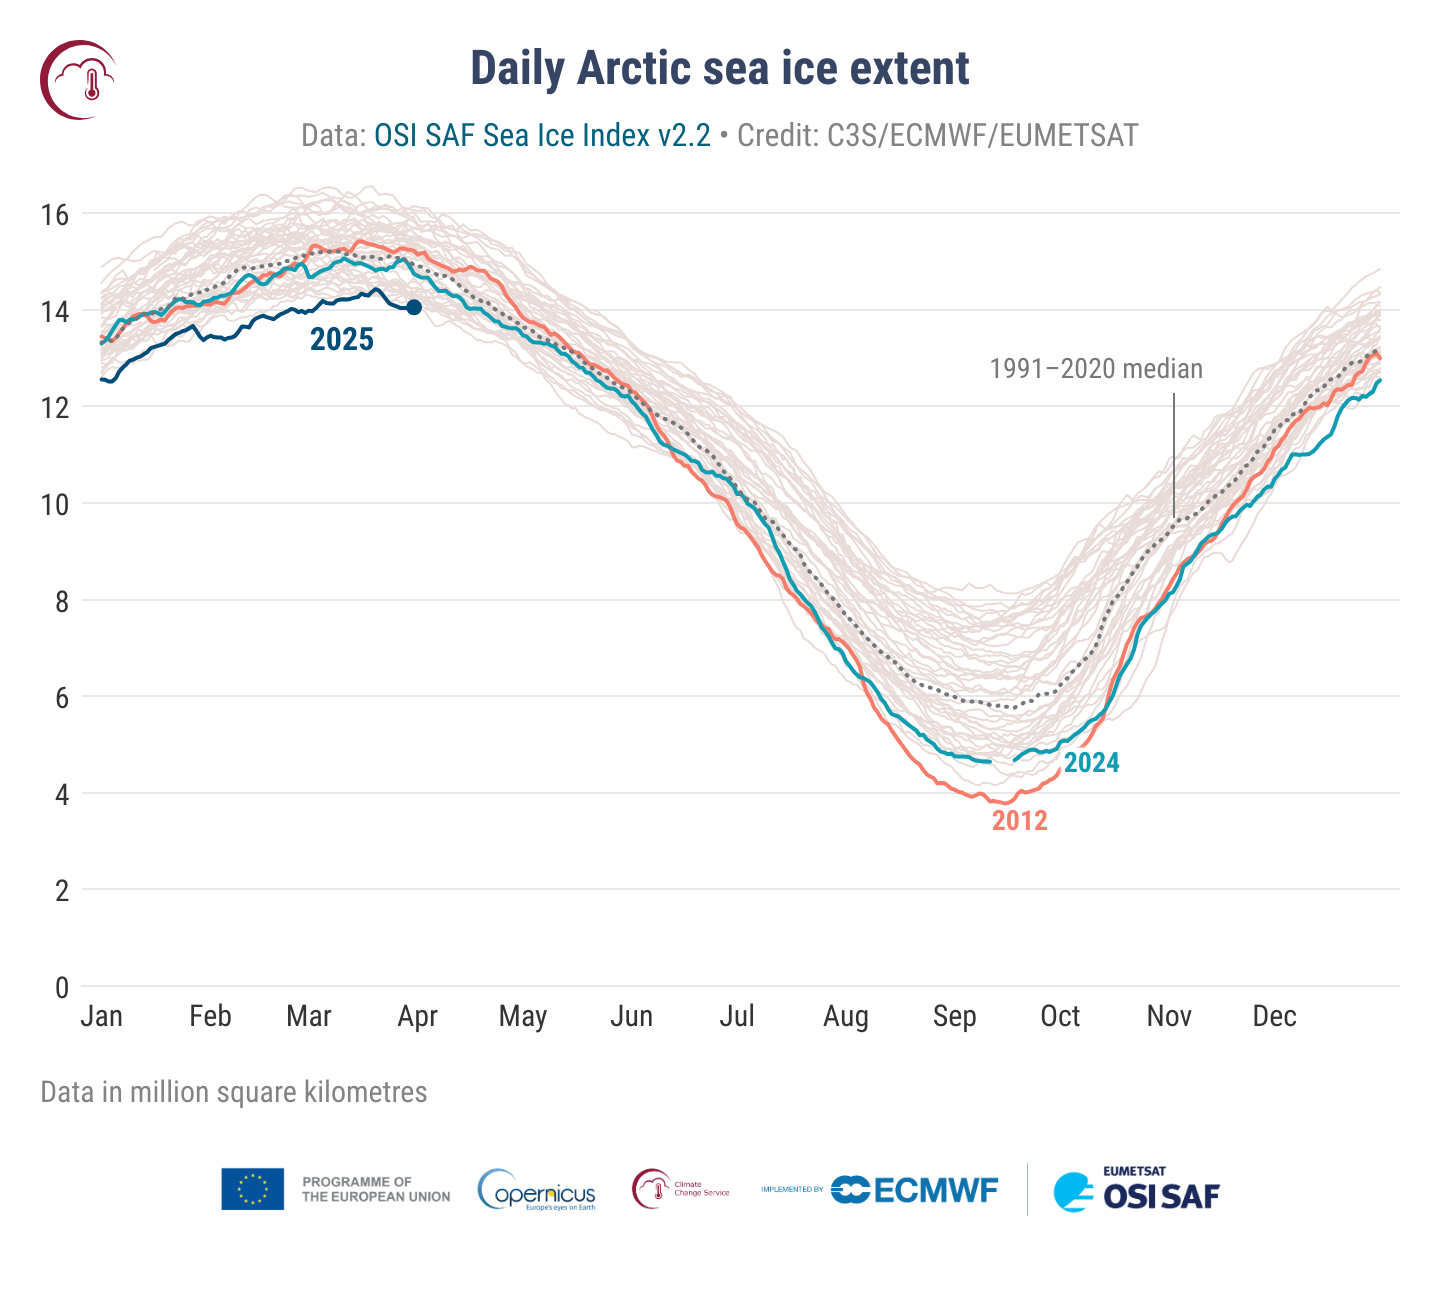
- Arctic sea ice reached its lowest monthly extent for March in the 47-year satellite record, at 6% below average. This marks the fourth consecutive month in which the sea ice extent has set a record low for the time of year.
- As Arctic sea ice also reached its annual maximum extent in March, the month marked the lowest annual maximum ever recorded for the region.
- In the Arctic region, sea ice concentrations were below average in most ocean sectors outside the central Arctic Ocean, particularly in the Barents Sea and Sea of Okhotsk.
- Antarctic sea ice recorded its fourth lowest monthly extent for March, at 24% below average.
- In the Antarctic region, sea ice concentrations were below average in most ocean sectors, with the exception of the western Weddell Sea.
March 2025—Hydrological highlights:
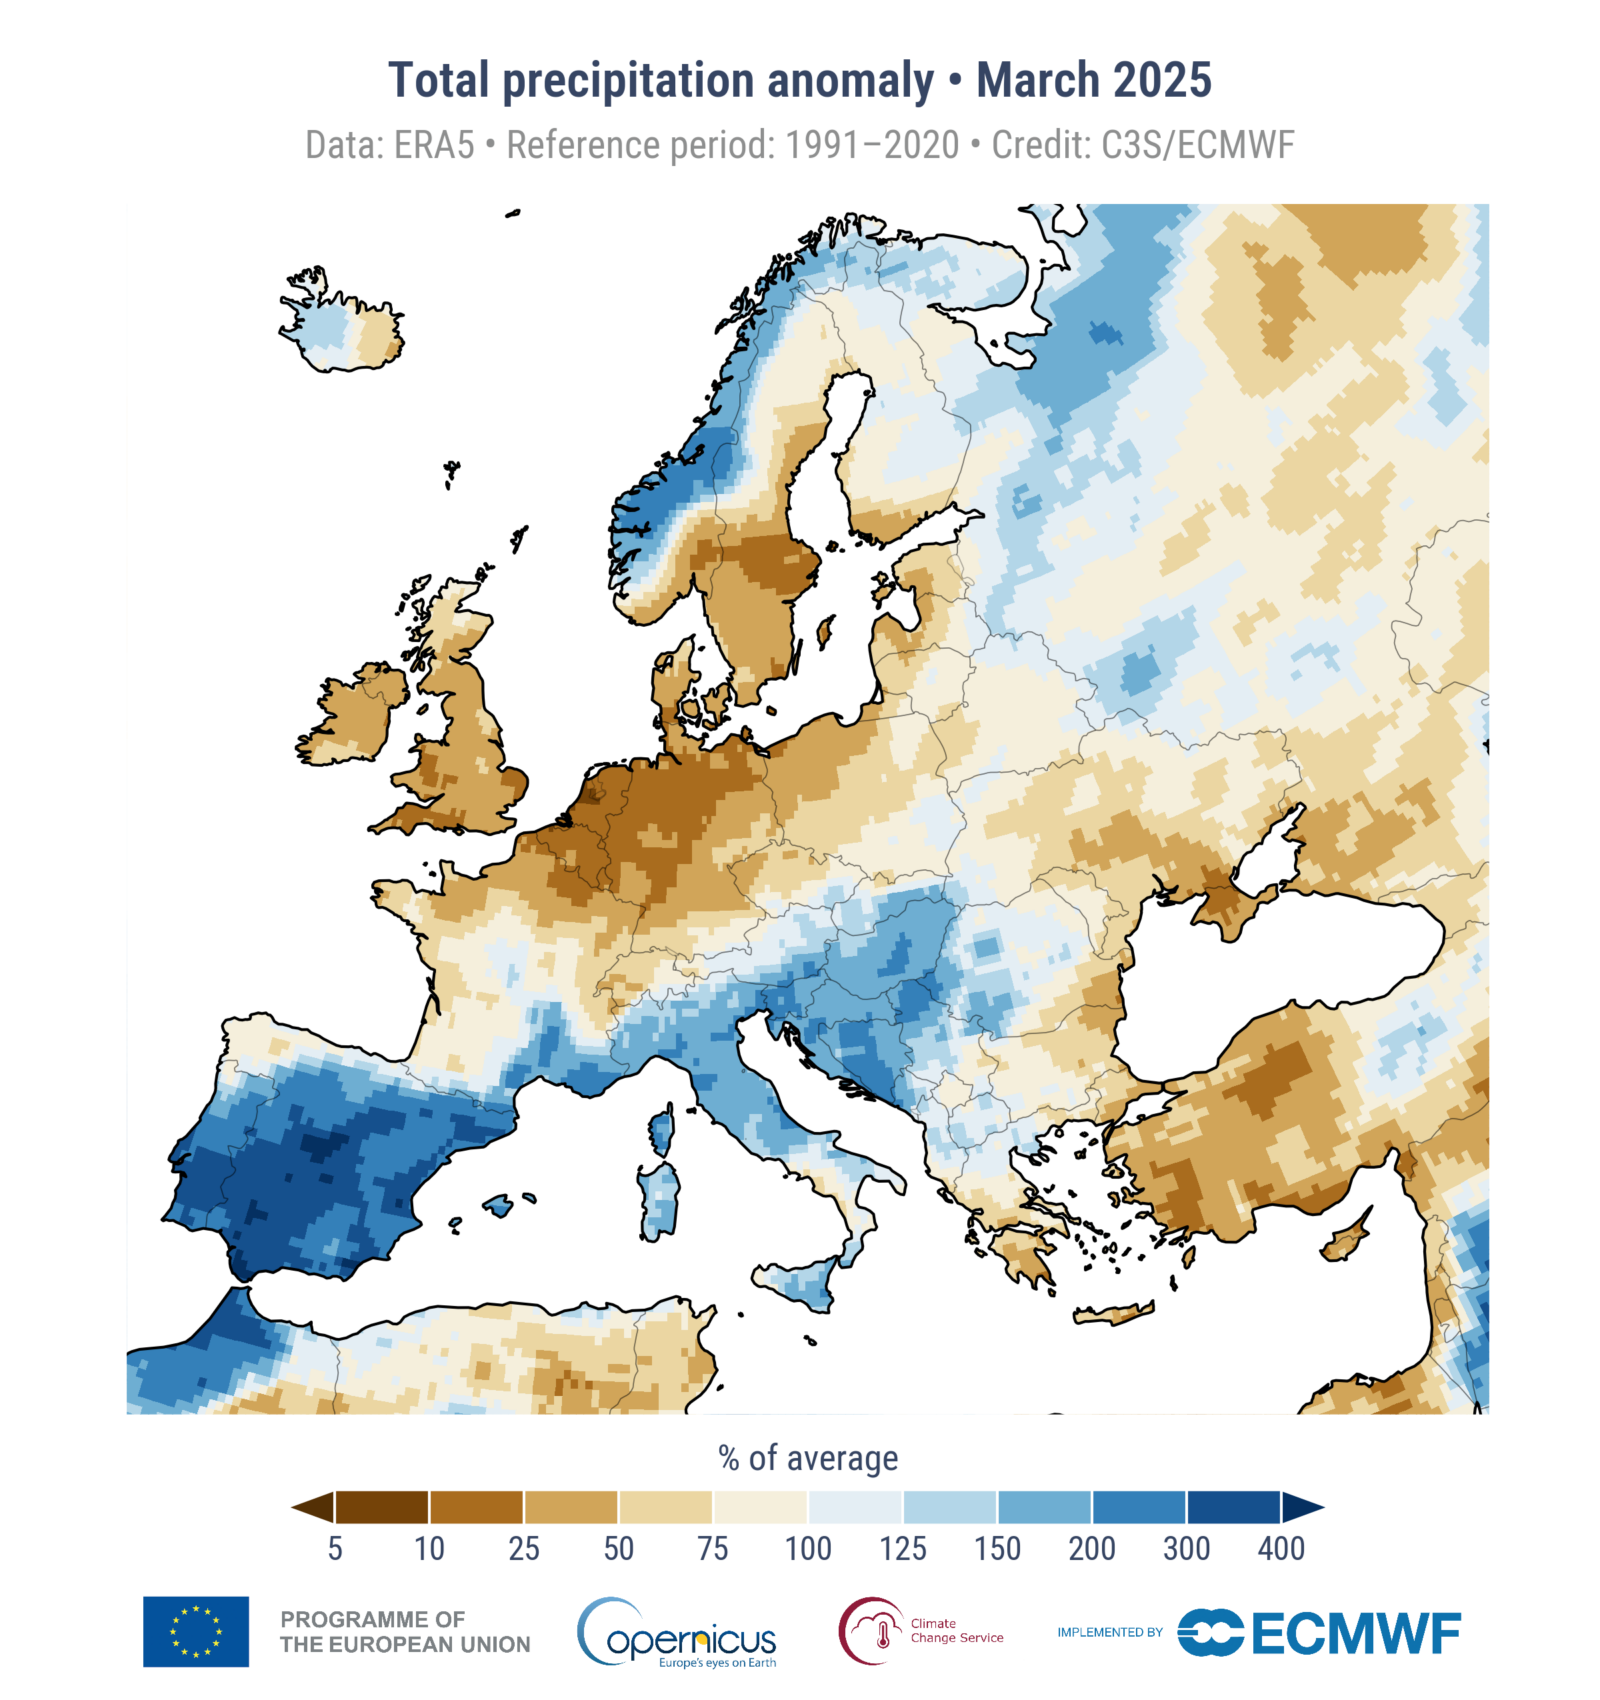
- In March 2025, most of southern Europe saw wetter-than-average conditions, in particular over the Iberian Peninsula, which was hit by a series of storms and saw widespread floods. Further wetter-than-average regions include Norway, parts of Iceland, and northwestern Russia.
- Conversely, it was drier than average in the UK and Ireland, in a large west-east band across central Europe extending southward to the Black Sea, Greece, and Türkiye.
- In March 2025, it was drier than average in most of North America, southwestern, central, and easternmost Asia, southwestern Australia, parts of southern Africa, and southeastern South America.
- Wetter-than-average conditions were seen in eastern Canada, western USA, the Middle East, across Russia, and in parts of central Asia, southeastern Africa, and northeastern Australia.
More information about climate variables in March and climate updates of previous months as well as high-resolution graphics can be downloaded here.
Other useful links:
- Answers to frequently asked questions regarding temperature monitoring can be found here.
- Follow near-real-time data for the globe on Climate Pulse here.
- More on trends and projections on Climate Atlas here.
- Access key datasets easily with the new tool ERA Explorer App here.
Information about the C3S data set and how it is compiled:
Temperature and hydrological maps and data are from ECMWF Copernicus Climate Change Service’s ERA5 and ERA5-Land (surface soil moisture) datasets. The findings about global sea surface temperatures (SSTs) presented here are based on SST data from ERA5 averaged over the 60°S–60°N domain. Note that ERA5 SSTs are estimates of the ocean temperature at about 10m depth (known as foundation temperature). The results may differ from other SST products providing temperature estimates at different depths. Sea ice maps and data are from a combination of information from ERA5, as well as from the EUMETSAT OSI SAF Sea Ice Index v2.2. Regional area averages quoted here are the following longitude/latitude bounds: Globe, 180W-180E, 90S-90N, over land and ocean surfaces. Europe, 25W-40E, 34N-72N, over land surfaces only.
More information about the data can be found here.
Information on national records and impacts:
Information on national records and impacts is based on national and regional reports. For details, see the respective temperature and hydrological C3S climate bulletin for the month. C3S has followed the recommendation of the World Meteorological Organization (WMO) to use the most recent 30-year period for calculating climatological averages and changed to the reference period of 1991-2020 for its C3S Climate Bulletins covering January 2021 onward. Figures and graphics for both the new and previous period (1981-2010) are provided for transparency.
More information on the reference period used can be found here.
About Copernicus and ECMWF
Copernicus is the Earth observation component of the European Union’s space program, looking at our planet and its environment to benefit all European citizens. The program is coordinated and managed by the European Commission and implemented in partnership with the member states and European organizations.
The European Centre for Medium-Range Weather Forecasts (ECMWF) is both a research institute and a 24/7 operational service, producing global numerical weather predictions and other data for our member and cooperating states and the broader community. It operates a world-class supercomputer facility for weather forecasting and holds one of the largest meteorological data archives.
ECMWF is a key player in Copernicus, the Earth Observation component of the European Union’s Space program, by implementing quality-assured information on climate change (Copernicus Climate Change Service), atmospheric composition (Copernicus Atmosphere Monitoring Service), and contributing to information on flooding and fire danger (Copernicus Emergency Management Service). Together with ESA and EUMETSAT, ECMWF also delivers the EU’s Destination Earth initiative, which is developing prototype digital twins of the Earth.
More information on Copernicus: www.copernicus.eu
The ECMWF website can be found at https://www.ecmwf.int/
Bluesky:
@copernicusecmwf.bsky.social
@ecmwf.bsky.social
Instagram:
@Copernicusecmwf
@Copernicus_eu
@ecmwf.official
LinkedIn:
@CopernicusECMWF
#EUSpace

 Whether you have solar power or not, please complete our latest solar power survey.

Have a tip for CleanTechnica? Want to advertise? Want to suggest a guest for our CleanTech Talk podcast? Contact us here.
Sign up for our daily newsletter for 15 new cleantech stories a day. Or sign up for our weekly one on top stories of the week if daily is too frequent.
CleanTechnica uses affiliate links. See our policy here.
CleanTechnica's Comment Policy

